Wednesday 30 November 2011

JISC GEO Event – Break Out Session – Repurposing Geospatial Data

A small but passionate group (Shawn Day – Royal Irish Academy, Andrew Bradley – University of Leicester and Dave Carter – University of Leicester) met at Table 3 and discussed this topic.

All parties were advocates for, and very much in favour of, the reuse/repurposing of research data. There are big opportunities for efficiencies and costs savings in terms of data creation/collection, curation and management.

That said, researchers should not assume that repurposing is necessary as ‘straight forward’ and 'easy' at present. Researchers need to be mindful of a number of issues.

A number of points were discussed – the order below does not suggest a hierarchy or priority order.

How do you find what’s available?   - In England there are some national, subject specific and institutional repositories for data but it is not always easy to find out what is available and from where. In Ireland there is a real absence of these type of repositories – where do you go to get data?

Permissions/Licenses – You need to make sure that you can use the data you have found for your specific purpose. Depending on the type of license, then this could mean finding and checking with the ‘real’ data owners.

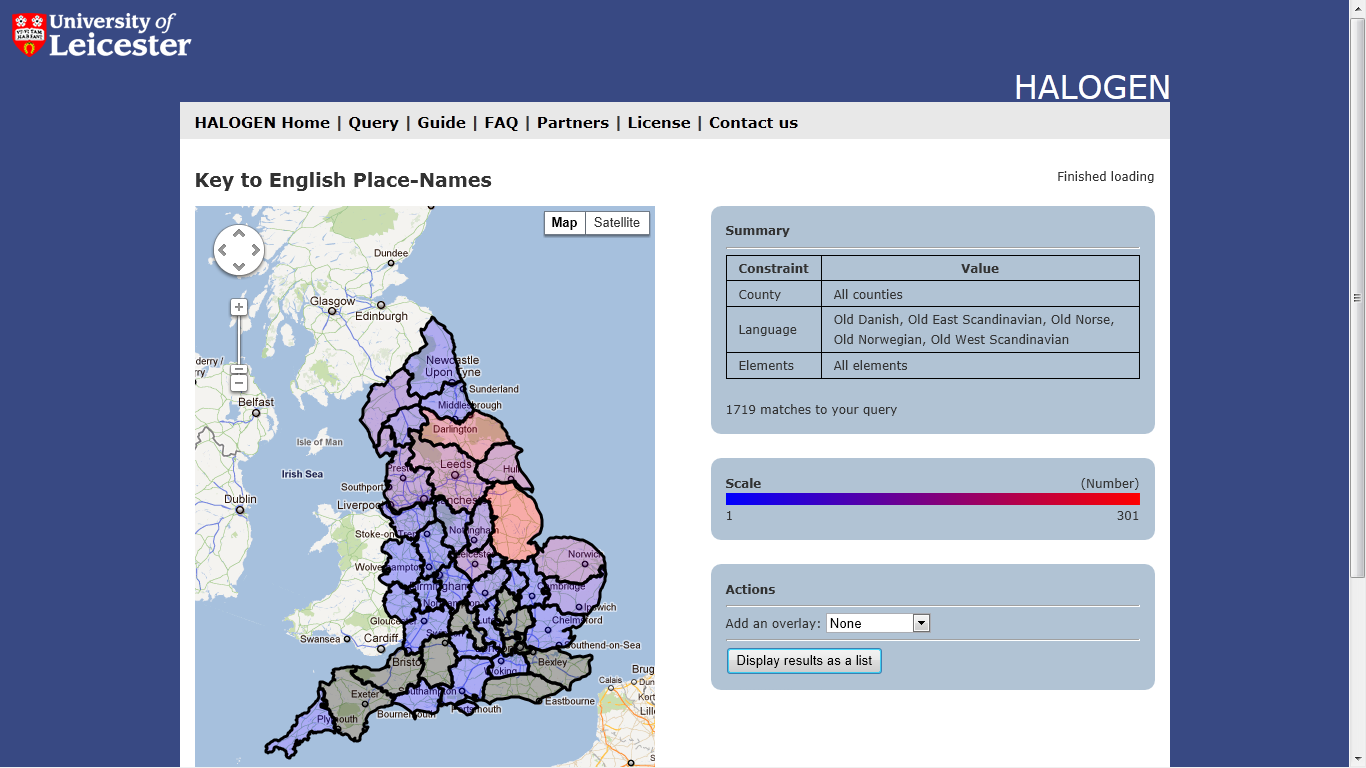
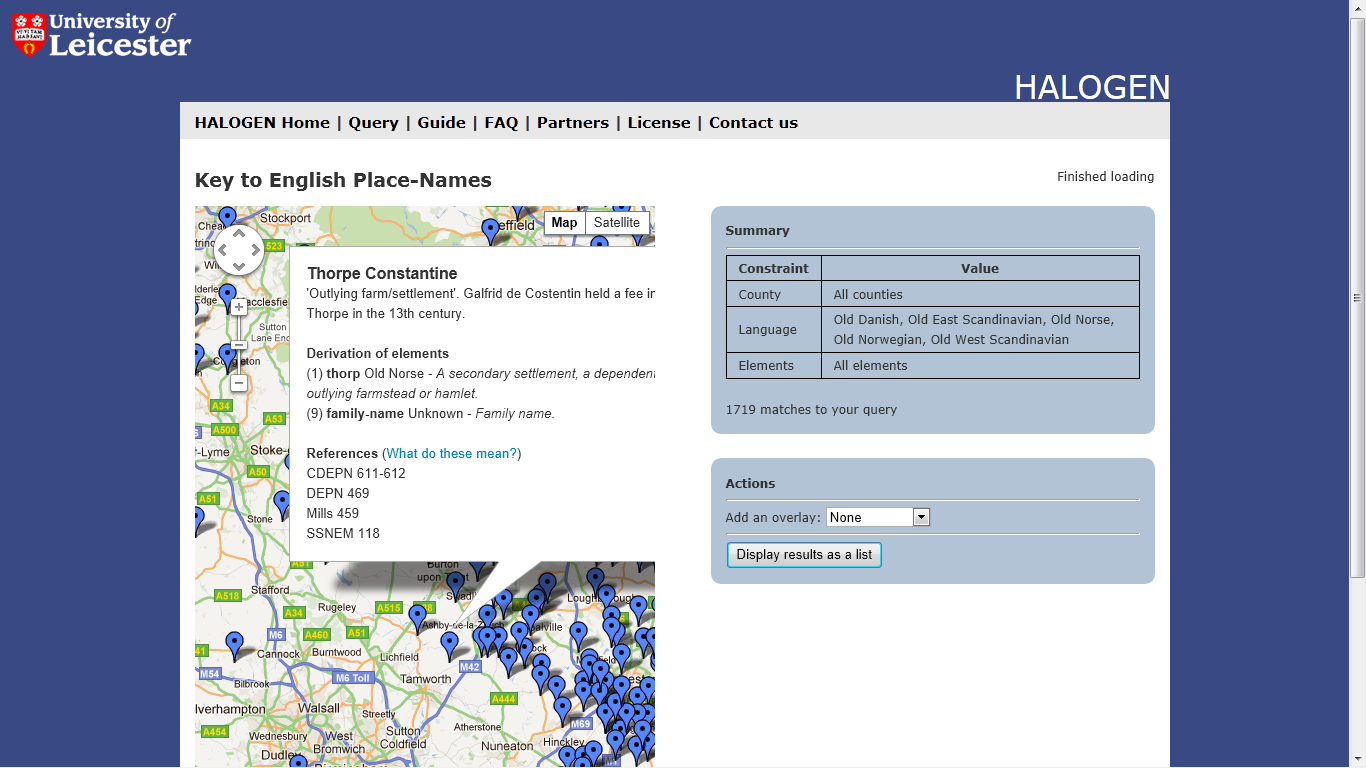
Ethical issues – In the case of the HALOGEN project we repurposed/reused genetic data. There were sensitivities around this as the personal data had been collected for a specific purpose and not for the purpose we had in mind. We had to apply for/receive approval from the University of Leicester’s Ethics Committee. Is it possible that we were looked on favourably as we were employees of the University? Politics potentially plays a part.

Standards – Specifically relating to geospatial shape file formats, a strong as bias towards commercial standards, specifically ESRI.  There are ‘open’ alternatives but are they really widely used?

Can you ‘understand’ the structure and assumptions of the data you have obtained? – There are many factors that help/hinder this. As a researcher if you want to have confidence in your results then you must be confident you understand the data on which they are based. If you’re repurposing data that logic still applies. You will need to have access to good quality documentation in terms of data glossary’s, data models and data dictionaries.

Metadata standards are crucial.

Ideally you want to be able to talk ideas and issues through with the original creator or someone who is close to the data.

For many data sources,  access to the above is very limited and the quality of documentation is variable. 

You really do need to understand the provenance of the data you are about to use. You need to undertake a risk assessment and think about all the issues up front – if you aren’t comfortable then you don’t use it!

We feel repository managers/data creators have a key role here as to some extent they need to be able to ‘guarantee’ the data they hold. The idea of ‘kite marks’ was discussed.

Are there automated tools that could be used to validate the structure/completeness of data sets (XML checkers were discussed)?

Forcing Researchers to Deposit Data – We feel one of the biggest barriers at present is the fact that researchers don’t necessarily have to make data available. Funders/funding bodies have a key role here as they should make the deposit of data in a ‘repository’ mandatory and specify the terms of any associated licenses.

… and from the above point comes our ‘Number 1’ recommendation – Funding bodies need to stipulate up front as part of any award that data derived as a result of the research they sponsor must be made available in a format that supports reuse and repurposing. This data should be deposited in either an institutional or subject specific repository. Exceptions to this should be allowed but they should be just that – justified exceptions. If each funding body maintained an index of the data sets they had sponsored one of the key barriers (access - in terms of finding out what is available!) would in part be overcome.

Over to you ………..

Thursday 10 November 2011

HALOGEN 2 Project - Final Product Post

This final blog post provides information on the primary product, a geospatial visualisation tool called HALO-view for researchers, produced by the HALOGEN 2 project.

Key Elements of HALOGEN2

The HALOGEN 2 project set out with two key objectives which should provide some context for the HALO-view tool we have produced.

Firstly, to develop and deliver better tools to researchers so that people with different levels of technical skill could access and get value from the HALOGEN datasets. HALOGEN (History, Archaeology, Linguistics, Onomastics and GENetics) is cross-disciplinary spatial research database established in 2010 (www.le.ac.uk/halogen). The database holds data for England from the British Museum’s Portable Antiquities Scheme, place name data from the University of Nottingham’s Institute for Name Studies and genetics data from the University of Leicester.

To do this we wanted to create a geospatial visualisation tool and a prototype data extraction tool was developed using Business Objects (http://www.sap.com/uk/solutions/sapbusinessobjects/index.epx) to allow researchers an easy way of accessing HALOGEN data and extracting subsets of data for statistical analyses with tools that they are already familiar with such as SPSS, SAS, Excel.

Secondly, we wanted to both extend the coverage of existing data sources and to add new data sources to the HALOGEN database. This involved acquiring, cleaning, formatting and ingesting two new sources of data into the HALOGEN database. The first of these is data on surname distributions based on 1881 census [1], and the second was additional genetics data from a previously published study [2]. In addition, the existing Portable Antiquities Scheme data was extended to cover the whole of England.

HALO-view Visualisation Tool

HALO-view - a spatial visualisation tool: simplifying and improving access to spatial data

The tool can be accessed at http://halogen.le.ac.uk/ Please email dpc15@le.ac.uk with any feedback.

The HALO-view tool allows non-technical users to query HALOGEN datasets through a simple web-based interface with the results displaying on a Google map.


When you begin using the visualisation tool it will automatically detect your location and display Place Name data associated with your current place name. From this first screen you can run a query to:

  • Discover the meaning of your own chosen place name.
  • View a whole county of place names.
  • Interrogate the entire country by language type and language element.
  • Search for the ‘treasure’ of England in the Portable Antiquities database using county or historical period.
  • Query parish, county or country-wide surname data from the Victorian census in 1881.
  • Explore summarised genetics data by county or counties, and for the specialist by genetic haplogroups.
  • Additional soil and Roman road map overlays to stimulate thinking on patterns and coincidences between the HALOGEN datasets.
For each data set there are a variety of ways to navigate the data: you can choose to explore either exact matches or use “fuzzy searches”; you can view the output either in mapping form or as a flexible tabular output; and you can also zoom in and out of mapped data and switch between satellite and map views.

Searching for English Place-Names

This screenshot of HALO-view shows a search for English Place-Names


If you ‘zoom in’ you can see a lower level distribution of points and by clicking on a ‘point’ you display its name and data on its derivation.


Looking for Treasure!

This screenshot shows a view of the ‘treasure’ of England in the Portable Antiquities database using county or historical period.


Zooming in and clicking on find displays further information.


Querying parish, county or country-wide surname data from the Victorian census in 1881

This screenshot shows the 1881 Census Surname overview


This screen shot shows an example of tabular output relating to the distribution of the Butters surname in Northamptonshire, Nottinghamshire, Leicestershire and Derbyshire.


Soil and Roman road map
The example below shows distribution of roman finds against the roman road overlay.


The only way to get a feel for the tool is to have a go using it.
GO ON GIVE IT A SPIN!

Who Is HALOGEN For?

Initially the project was targeted at two specific groups of researchers at the University of Leicester. The first group was the cross-disciplinary ‘Roots of the British’ collaboration (www2.le.ac.uk/projects/roots-of-the-british), a group of scholars grounded in humanities and genetics. Their mission is to interrogate evidence for the migration and/or continuity of human populations in the British Isles. The second group is from the ‘Impact of Diasporas’ Project (http://www2.le.ac.uk/projects/impact-of-diasporas) who plan to analyse and model relevant migration data. This tool is seen as a key facility for their data analysis work.

Quote from Professor Mark Jobling (Roots of the British Collaboration): "This project has been a very positive experience for us. It was efficiently managed, flexible (accommodating the introduction of new expertise as it went along), and has come up with a useful product that we will continue to develop".

"The novelty and multidisciplinary nature of the project has contributed to the success of other multidisciplinary grant applications, and in turn these will feed back into further developing, and sustaining the HALOGEN resource."

In addition the IT expertise, modernisation and quality control of old database structures has also opened the audience to specific user groups. For example, the project will be replacing the existing web enquiry facilities for the Institute of Name Studies ‘Key to English Place Names’ database run from the University of Nottingham. This will be used by researchers working at and with the Institute and by members of the general public who are interested in place-name etymology and who access the website out of general interest.

Quote from Jayne Carroll, Director of Institute for Name Studies:‘HALOGEN has not only incorporated KEPN into a larger dataset with interesting and potentially significant results, it has added functionality to KEPN as a stand-alone research tool, allowing finer-grained searches and a range of map interfaces, altogether improving on the original.’

What Are Our Future Plans?
It’s the view of the project team, and evidenced in the quotes from our researchers above, that the HALOGEN and HALO-view systems have huge potential. Ideas on improving the products are many and include:
  • Increasing the number of datasets included in the database and available through HALO-view. Discussions are underway at Leicester to consider adding further genetics data that could support genome and population researchers.
  • Improving HALO-view so that it allows users to run queries across multiple datasets at the same time as an aid to easily exploring relationships and patterns between different types of data.
  • Developing and offering a ‘service’ to researchers who do not have access to the level of technical expertise available at Leicester. The idea being in return for a researcher sharing their data, we would clean it, apply spatial data, ingest it into HALOGEN and make their data available back to them through the HALO-view tool. They would then be able to visualise their data against other datasets, and in return another source of data would be made available to our community.
To address the above, funding is required. We feel HALOGEN and HALO-view provide a model for researchers looking to explore multiple complementary geographically referenced data sets. There is an opportunity for other researchers to reuse our approach and tools, as well as learning lessons from our work as they work on projects in their own institutions and disciplines.

Licensing

The outputs from the project will be backed up, managed and supported by IT Services at the University of Leicester for at least 3 years.

All project documentation whatever its form is governed by a license agreement complying with Creative Commons Attribution-Non Commercial- Share Alike 3.0, and all code is licensed under terms compliant with the terms of the GNU General Public License version 3.0. The code will be made publically available at: https://svn.rcs.le.ac.uk/public/halogen/HALOview

References and Documentation

These links provide access to information on the HALOGEN2 data sets and how to use the HALO-view tool:

  • [1] Schürer, K. and Woollard, M., 1881 Census for England and Wales, the Channel Islands and the Isle of Man (Enhanced Version) [computer file]. Genealogical Society of Utah, Federation of Family History Societies, [original data producer(s)]. Colchester, Essex: UK Data Archive [distributor], November 2000. SN: 4177, http://dx.doi.org/10.5255/UKDA-SN-4177-1
  • [2] Capelli, C., Redhead, N., Abernethy, J. K., Gratrix, F., Wilson, J. F., Moen, T., Hervig, T., Richards, M., Stumpf, M. P. H., Underhill, P. A., Bradshaw, P., Shaha, A., Thomas, M. G., Bradman, N. & Goldstein, D. B., A Y Chromosome census of the British Isles (2003). Current Biology 13, 979-984.
  • User guide for visualisation tool: http://halogen.le.ac.uk/guide/
  • Data Glossary for HALOGEN database: http://www2.le.ac.uk/offices/itservices/resources/cs/pso/project-websites/halogen/documents/Data-glossary-V2.3.pdf
  • Technical Guide for Visualisation Tool: (In preparation - link to be added)

Acknowledgements
The team gratefully acknowledge the support and funding provided by JISC, without which this work would not have been possible.


We would also like to thank our partners and data providers, a full list of whom can be found here: http://halogen.le.ac.uk/partners/


Finally we would like to gratefully acknowledge the effort and expertise of all project team members who have helped us to meet our goals and deliver this exciting project as envisioned in our original funding bid:

Top Row – left to right: Anthony Gibson, Senior Application Support Analyst (Business Objects), Dr Olly Butters, Developer and Database Analyst, Dr Jon Wakelin, Research Computing Services Architect, Liam Gretton, Research Computing Services Architect.

Bottom Row – left to right: David Carter, Project Manager, Mark Widdowson, Senior Database Analyst, Dr Andrew Bradley, GIS Specialist.

Table of Contents for Project Blog
Project specific information can be found using the links below:
Project Planning
http://leicesterhalogen2.blogspot.com/2011/03/project-plan-post-1-of-7-aims.html

http://leicesterhalogen2.blogspot.com/2011/03/project-plan-post-2-of-7-wider-benefits.html

http://leicesterhalogen2.blogspot.com/2011/03/project-plan-post-3-of-7-risk-analysis.html

http://leicesterhalogen2.blogspot.com/2011/03/project-plan-post-4-of-7-ipr-licensing.html

http://leicesterhalogen2.blogspot.com/2011/03/project-plan-post-5-of-7-project-team.html

http://leicesterhalogen2.blogspot.com/2011/03/project-plan-post-6-of-7-projected.html

http://leicesterhalogen2.blogspot.com/2011/03/project-plan-post-7-of-7-budget.html

Project Progress Reports
http://leicesterhalogen2.blogspot.com/2011/03/small-wins-fails-progress-update-for.html

http://leicesterhalogen2.blogspot.com/2011/04/project-update-for-march-2011.html

http://leicesterhalogen2.blogspot.com/2011/05/progress-update-for-april.html

http://leicesterhalogen2.blogspot.com/2011/07/progress-update-for-june.html

http://leicesterhalogen2.blogspot.com/2011/08/progress-update-for-august.html

General – Technical Issues, User Feedback and Issues

User excitement at demonstration: http://leicesterhalogen2.blogspot.com/2011_04_01_archive.html
ArcGIS data exchange issues:
http://leicesterhalogen2.blogspot.com/2011/04/project-evaluation-arcgis-data-exchange.html
Open access debate – views & thoughts.
http://leicesterhalogen2.blogspot.com/2011/06/rcuk-and-hefce-announcement-to-support.html
MySQL & ArcGIS.
http://leicesterhalogen2.blogspot.com/2011/08/mysql-server-and-arcgis.html

http://leicesterhalogen2.blogspot.com/2011/10/arcgis-93-mysql.html

Plotting aggregated points over Google Earth satellite images.
http://leicesterhalogen2.blogspot.com/2011/08/plotting-aggregated-points-over-google.html

Friday 28 October 2011

ArcGIS 9.3 -> MySQL

At the core of HALOGEN sits a MySQL database that stores several different geospatial data sets. Each data set is generally made up of several tables and has a coordinate for each data point. Now most of the geo-folk here like to use ArcGIS to do their analysis and since we have it (v9.3) installed system-wide I thought I would plug it into our database. Simple.

As it happens the two don’t like to play nicely at all.

To get the ball rolling I installed the MySQL ODBC so they could communicate. That worked pretty well with ArcGIS being able to see the database and the tables in it. However, trying to do anything with the data was close to impossible. Taking the most simple data set that consisted of one table I could not get it to plot as a map. The problem was the way ArcGIS was interpreting the data types from MySQL; each and every one was being interpreted as a text field. This meant that it couldn’t use the coordinates to plot the data. I would have thought that the ODBC would have given ArcGIS something it could understand, but I guess not. The work around I used for this was to change the data types at the database level to INTs (they were stored as MEDIUMINTs on account of being BNG coordinates). I know this is overkill, and a poor use of storage etc, but as a first attempt at a fix it worked.

Then I moved on to the more complex data sets made up of several tables with rather complex JOINs needed to properly describe the data. This posed a new problem, since I couldn’t work out how to JOIN the data ArcGIS side to a satisfactory level. So the solution I implemented here was to create a VIEW in the database that fully denormalized the data set. This gave ArcGIS all the data it needed in one table (well, not a real table, but you get the idea).

If we take a step back and look at the two ‘fixes’ so far, you can see that they can be easily combined in to one ‘fix’. By recasting the different integers in the original data in the VIEW, I can keep the data types I want in the source data and make ArcGIS think it is seeing what it wants.

And then steps in the final of the little annoyances that got in my way. ArcGIS likes to have an index on the source data. When you create a VIEW there is no index information cascaded through, so again ArcGIS just croaks and you can’t do anything with the data. The rather ugly hack I made to fix this (and if anyone has a better idea I will be glad to hear it) was to create a new table that has the same data types as those presented by the VIEW and do an

INSERT INTO new_table SELECT * FROM the_view

That leaves me with a fully denormalised real table with data types that ArcGIS can understand. Albeit at the price of having a lot of duplicate data hanging around.

Ultimately, if I can’t find a better solution, I will probably have a trigger of some description that copies the data into the new real table when the source data is edited. This would give the researchers real-time access to the most up-to-date data as it is updated by others. Let’s face it, it’s a million times better than the many different Excel spreadsheets that were floating around campus!

Wednesday 31 August 2011

Progress Update for August

The team continue to make good progress.

Data Sources
All the new data sources originally identified have been added to the HALOGEN database.

Tools Development and Evaluation

Development of prototypes of the ‘data extraction tool’ (using Business Objects) and a ‘web based enquiry tool’ continues.

The second iteration of the ‘web based enquiry’ development was presented to Nottingham users in late June and to the Roots of the British/Diaspora researchers at Leicester in July. Feedback from these sessions has been used to enhance its presentation and functionality.

A prototype of the business objects based data extraction tool has been delivered to researchers at Leicester and they are evaluating its use.

Other

A visit from David Flanders - JISC Programme Manager occurred on the 2nd August and highlighted a number of hot topics (most notably data licensing issues and ideas on how to test our deliverables). The feedback from this session was very positive.

Photo below - left to right: Olly Butters, Andrew Bradley, Jonathan Tedds and Dave Carter.


Monday 8 August 2011

MySQL server and ArcGIS

Olly and Liam got to grips with linking ArcGIS and MySQL server last week, essentially they have created a method to allow ArcGIS to talk directly to the HALOGEN data without the need to export data (e.g. as a csv or tab delimited text file). So far it looks like we can query directly on the database. Why is this great news you ask? Before I created an events theme in ArcGIS which was then converted to a shapefile, unfortunately with large volumes of data we exceeded the maximum size of shapefiles and therefore could not query the data any further without a crash. We still need to test and see if relational databases work though, watch this space...

Andrew.

Tuesday 2 August 2011

Plotting aggregated points over Google Earth satellite images

Olly has created a web interface that plots our data on to Google Earth satellite images. Our data is aggregated to the centre of BNG 1km squares to preserve confidentiality and to standardise the resolution of our database as there are several different data sources to compare. I am concerned that end users may forget / not read the project documentation and think that a point marks the exact location of data when in reality it could be anywhere in a km square around the point.  Does anyone else share these concerns - or have a way of reminding an end user of this?

Andrew.

Tuesday 5 July 2011

Progress Update for June

Good progress is being made and we have now delivered the new data sources as planned!

Data Sources

A key target was to complete the load of the new data sources to HALOGEN during June and this has been achieved. Well done Olly and Andrew !

The coverage of the PAS data has been increased to all of England. The Capelli data and 1881 Surname census data has now been added to the database.  

The load of an additional source of surname data has been requested and will be added over the next few months.

Tools Development and Evaluation

Development of prototypes of the ‘data extraction tool’ (using Business Objects) and a ‘web based enquiry tool’ continues.

A plan for the iterative development of the ‘web based’ enquiry has been agreed. The second iteration of development is now complete and the system was presented to users at Nottingham University's Institute of Name Studies on 28th June.


Other

A communications plan to support internal dissemination activity relating to the project has been drafted for Board approval.

We had our first Project Board meeting on 27th May and that went well.

Dave Flanders, our JISC Programme Manager has scheduled a visit for 2nd August.